Compass National Real Estate Insights - July 2025
Long-term trends in house and condo/co-op median sales prices: Both hit new highs in June 2025.
As is not unusual, the number of new listings coming on the market in June ticked down after peaking earlier in the spring, but it increased 6% year over year, and was the highest June count since interest rates soared in the first half of 2022. The "mortgage lock-in effect" affecting prospective sellers continues to slowly weaken.
This chart below estimates the number of homes on the market on any given day of the month specified, which is a different angle from the total number of listings on the market within the month and is affected by how fast homes sell: A slower velocity of sales helps push up the number of daily listings. By this metric, inventory in June 2025 hit its highest count since 2019, though remaining lower than pre-pandemic norms.
The daily number of listings which have accepted offers - aka listings pending sale, or listings in contract - is a leading indicator of how many sales will close in 3 to 6 weeks. The June 2025 count fell slightly from May, but rose 4% over June 2024.
Months-supply-of-inventory (MSI) is a measurement of buyer demand vs. the supply of homes available to purchase: The higher the reading, the softer the market. Because the number of listings for sale has risen much faster than the number of listings going into contract - i.e. supply outpacing demand - June MSI hit its highest reading in over 6 years, tilting the market to buyers' advantage. By property type, the house market (MSI of 4.5 months in June) is much stronger than the condo/co-op market (MSI of 6.5 months).
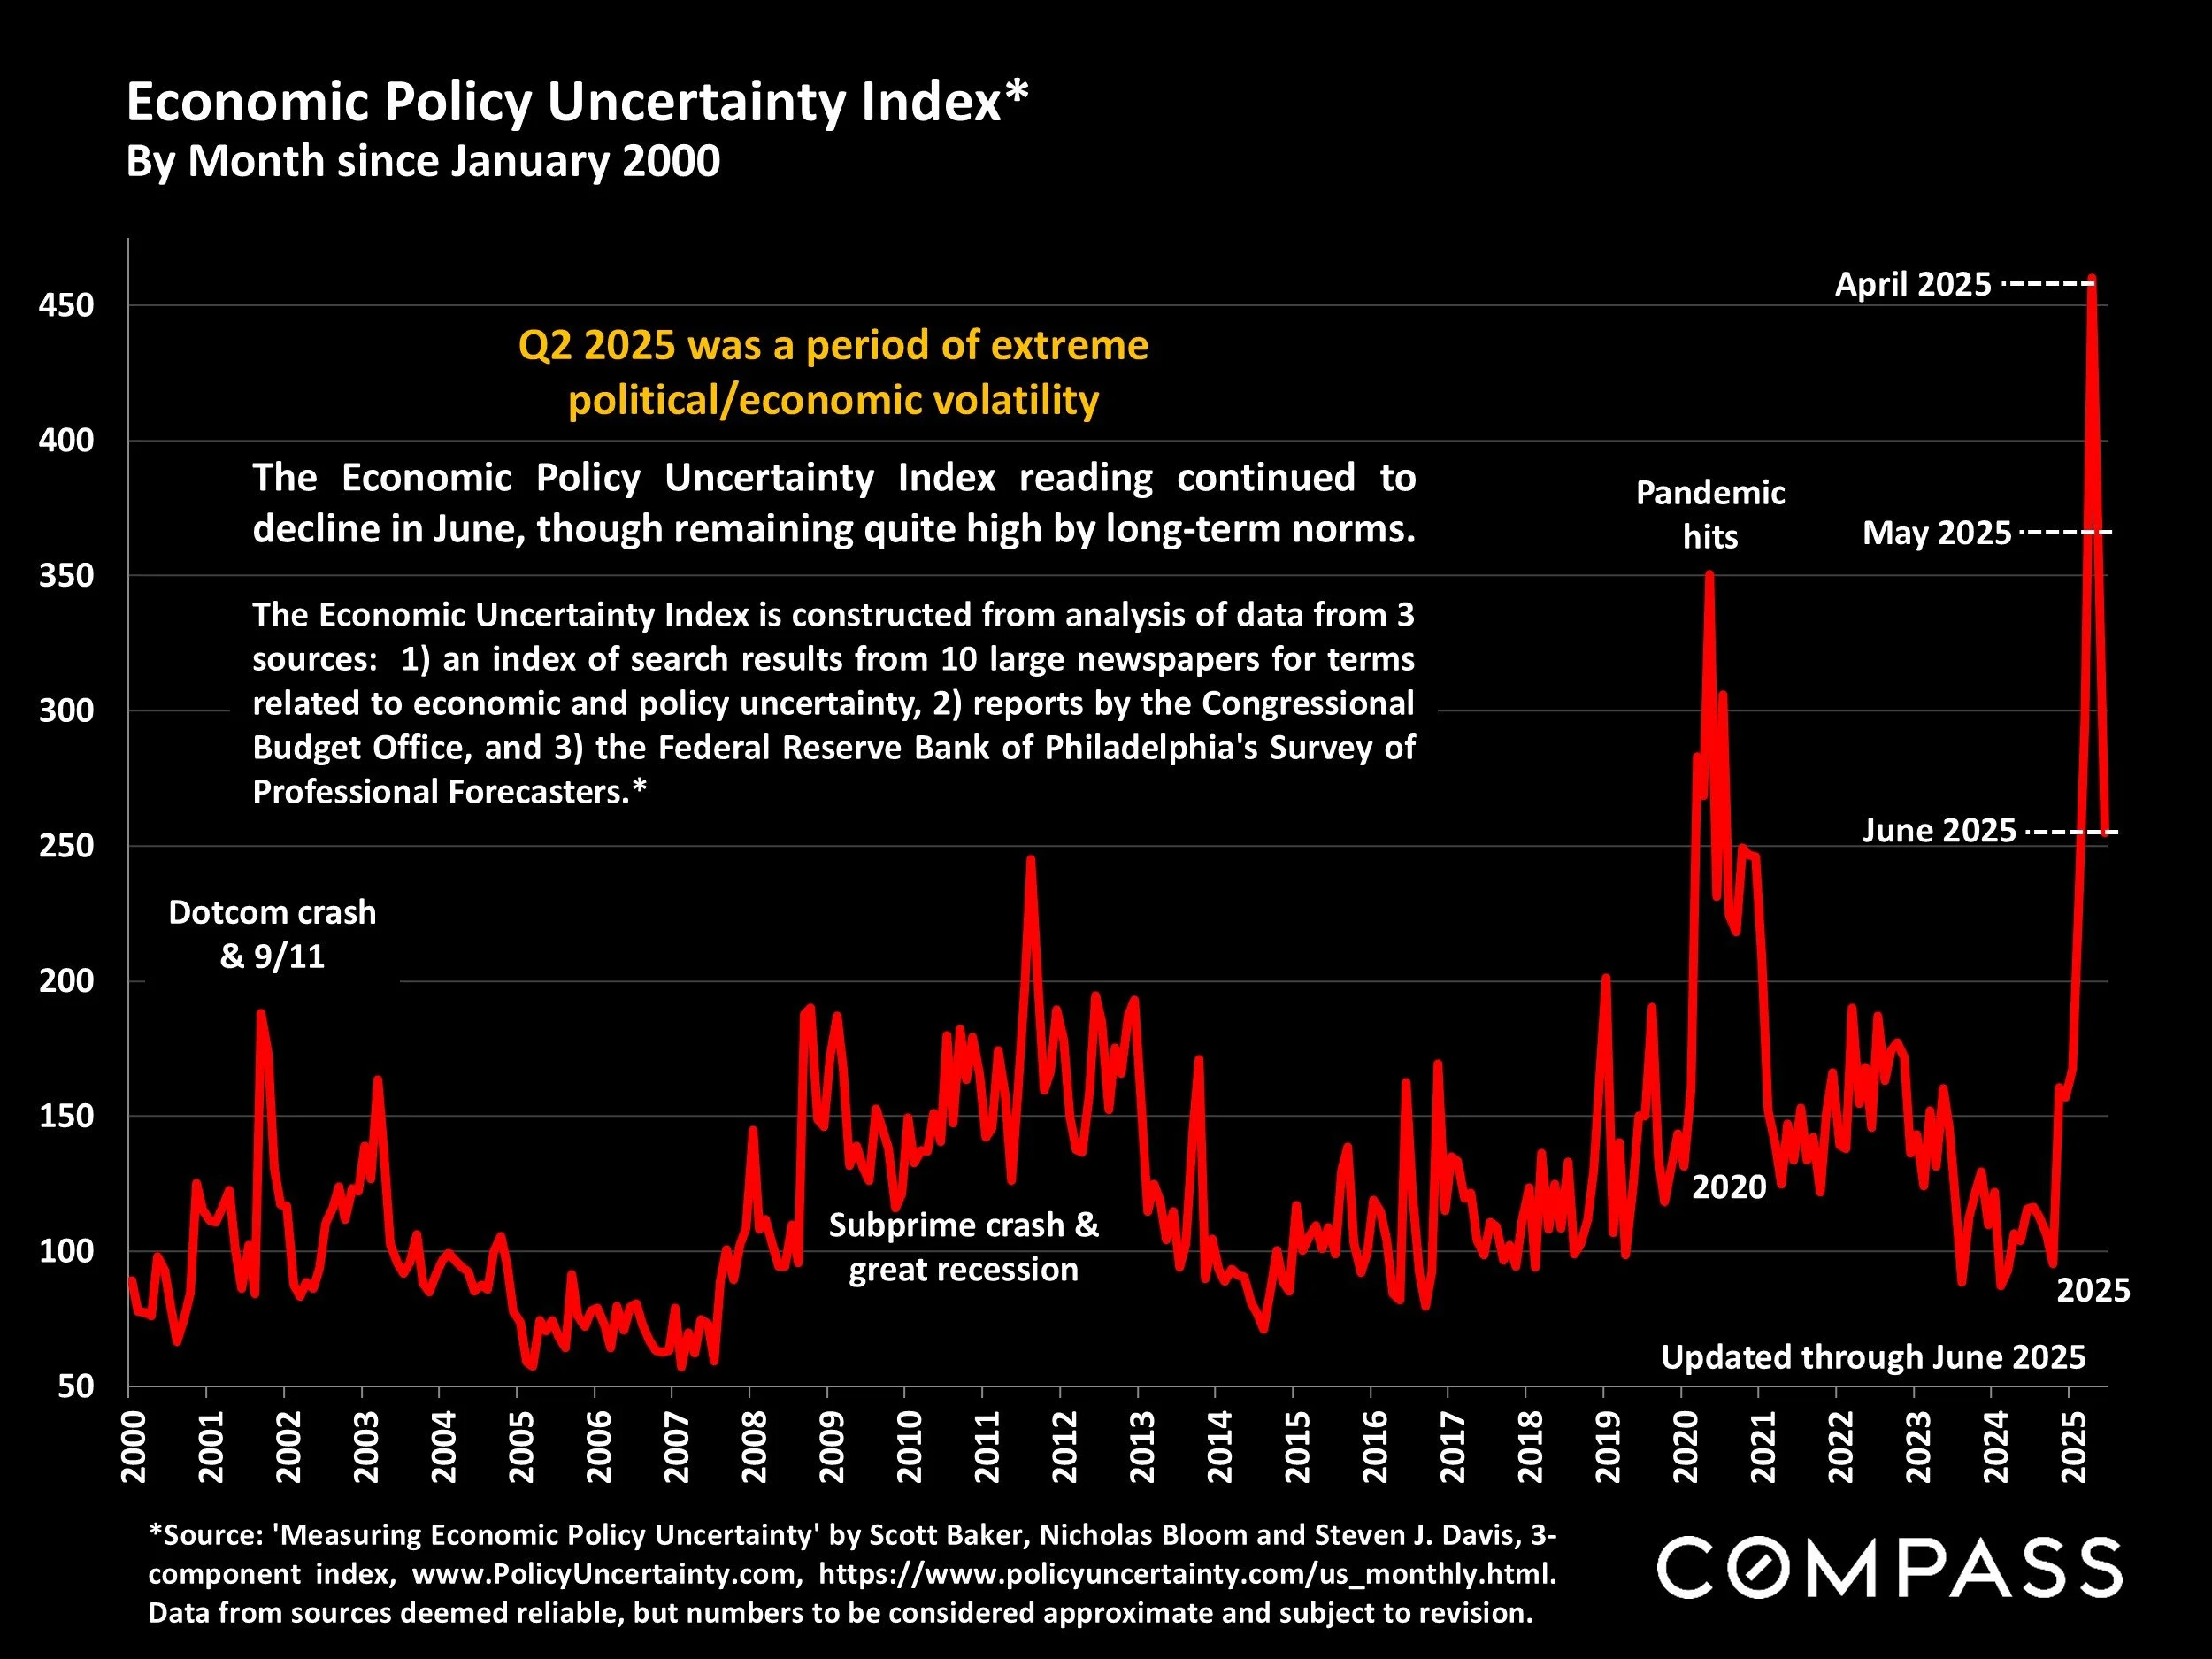
The number of sales in June increased very slightly from May, but rose 4% over June 2024, the first monthly, year-over-year increase since January. This suggests that we may be moving out from under the shadow of the severe economic uncertainty which prevailed during much of the spring selling season.
The next 2 charts look at price reductions, first by the number occurring within the month, and then by the monthly percentage of listings that reduced their asking price. Both readings have continued to rise. When the market is hot and demand outpaces supply, buyers compete for listings. When the market cools and supply outpaces demand, sellers begin to compete for buyers - most typically by reducing price. Note that a good proportion of homes are still selling quickly with multiple offers. Much depends on the pricing, preparation and marketing of the home.
The speed at which listings sell has been slowing on a year-over-year basis ever since the pandemic boom ended in Q2 2022, but is not running particularly slow by longer-term norms. Still, buyer and seller expectations are typically set by what they got used to in recent years, not by what was normal 6+ years ago. And by that standard, the market seems significantly cooler and they are reacting accordingly.
The National Association of Realtors just released their report on foreign-national homebuying in the 12 months through March 2025. International buyers have played large roles in many U.S. markets for years, and in the last period measured, they significantly increased their purchase volume. But this report won't take into account the enormous changes in tariff and immigration policies that have occurred in recent months, and anecdotal reports suggest a substantial impact. As one example, most Canadians have apparently not been pleased by recent tariff threats, much less suggestions that Canada should be absorbed into the U.S.
Following are selected snapshots of major macroeconomic trends.
Please let me know if you have any questions or if I can be of assistance in any way.


